
Pairwise comparison of data-sets is very important. It allows us to compare two sets of data and decide whether: * one is better than the other, * one has more of some feature than the other, * the two sets are significantly different or not.
In the context of the weather data that you've been working with, we could test the following hypotheses: * Hypothesis 1: The mean temperature in China is greater than the mean temperature in Japan * Hypothesis 2: The mean humidity in Russia is greater than the mean humidity in Spain
There are many tests for rejecting the null hypothesis (that there is no difference between the two data-sets), which one you use depends on the properties of your data-set. Below is a brief list of some of the available tests:
| Parametric | Non-parametric |
|---|---|
| Paired t-test | Wilcoxon signed-rank test |
| Unpaired t-test | Mann-Whitney U test |
| Pearson correlation | Spearman correlation |
| ... | ... |
You can see they've been divided into two groups, parametric tests and non-parametric tests. Which group you use again depends on the properties of your data-set, in this case it's whether your data-sets follow a specific distribution. Typically, if your data-set doesn't follow a specific distribution, you want to use a non-parametric test. These tests don't make any assumptions about the distribution of your data.
Before we move onto running any of these tests - we need to determine a sufficient sample size. This is because we cannot make a reliable judgement if, for example, we only compare 4 temperature readings from Japan to 4 from China. The mean temperature of both countries may be the same - but was there enough data to make this claim?
Sample Size Sufficiency
Let's get straight into it! We will be using numpy, matplotlib.pyplot, and pandas, so make sure to import these in the following cell. I've imported numpy for you. If you have access to it, I recommend also importing seaborn which automatically improves the quality of your plots. You may not have this in your environment so feel free to comment it out.
%matplotlib inline
import numpy as np
import pandas as pd
import matplotlib.pyplot as plt
Dataset
Now we want to load in our data-set from the CSV file. You can use the pd.read_csv() function. You will also need to add the following column names:
wt.columns = ['time', 'country', 'humidity', 'pressure', 'temp', 'max_temp', 'min_temp']
# load data into variable 'wt' here
wt = pd.read_csv("weather.csv", names=['time', 'country', 'humidity', 'pressure', 'temp', 'max_temp', 'min_temp'])

# output a sample of the data for inspection...
wt.head()
| time | country | humidity | pressure | temp | max_temp | min_temp | |
|---|---|---|---|---|---|---|---|
| 0 | 15/03/14 | NP | 33.0 | 1020.00 | 297.15 | 297.15 | 297.15 |
| 1 | 15/03/14 | VE | 99.0 | 835.59 | 288.64 | 288.64 | 288.64 |
| 2 | 15/03/14 | CN | 12.0 | 613.65 | 280.79 | 280.79 | 280.79 |
| 3 | 15/03/14 | TR | 87.0 | 1021.00 | 283.42 | 284.15 | 283.15 |
| 4 | 15/03/14 | DO | 100.0 | 1020.65 | 295.14 | 295.14 | 295.14 |
Sample size sufficiency
Let's check the sample size sufficiency for Hypothesis 1, for this we will need to pick out the temperatures for China and Japan, let's store them in variables named temp_JP and temp_CN respectively.
# variables holding the temperatures for Japan and China
temp_JP = wt[wt.country=='JP'].temp
temp_CN = wt[wt.country=='CN'].temp
So we have an idea of the number of samples for each data-set, let's print out the number of samples for inspection. There are man ways to do this, using .count(), .size, .shape, etc.
# print out the number of samples for inspection
print("number of temperature samples for Japan: {}".format(temp_JP.count()))
print("number of temperature samples for China: {}".format(temp_CN.count()))
number of temperature samples for Japan: 708
number of temperature samples for China: 282
Next, let's store the mean of temp_JP and temp_CN in variables named temp_JP_mean and temp_CN_mean respectively
# variables holding the mean temperature for Japan and China
temp_JP_mean = temp_JP.mean()
temp_CN_mean = temp_CN.mean()

# print out the means for inspection
print("mean temperature in Japan: {}".format(temp_JP_mean))
print("mean temperature in China: {}".format(temp_CN_mean))
mean temperature in Japan: 281.62871468926556
mean temperature in China: 288.6073404255319
It may be tempting at this point to state that the temperature in China is typically warmer than the temperature in Japan. But this could simply be by chance! We must be confident that we can make this claim with some statistical significance.
Now that we have the data-sets and their means, we can have a look at the relationship between sample sizes and the Standard Error of the Mean (SEM). The formula for this is:
We will implement this for all our possible sample sizes for Japan, and then China below.
SEM = []

for sample_size in range(3,len(temp_JP)):
    sample = temp_JP[0:sample_size]
    SEM.append(sample.std() / np.sqrt(sample_size))

plt.plot(SEM, color='magenta')
plt.plot(200,SEM[200], marker='o', color='cyan')

plt.ylabel("Standard Error of the Mean ($SE_M$)")
plt.xlabel("Sample size $(n)$")
plt.title("Relationship between $SE_M$ and $n$");

SEM = []

for sample_size in range(3,len(temp_CN)):
    sample = temp_CN[0:sample_size]
    SEM.append(sample.std() / np.sqrt(sample_size))

plt.plot(SEM, color='magenta')
plt.plot(200,SEM[200], marker='o', color='cyan')

plt.ylabel("Standard Error of the Mean ($SE_M$)")
plt.xlabel("Sample size $(n)$")
plt.title("Relationship between $SE_M$ and $n$");

In the two figures above we can see that we have selected sufficient sample sizes of 200 for Japan and China. This decision has been made visually based on the dispersion of the samples. There are many ways of doing this, but let's move onto using these samples to test our hypothesis!
Normal Distribution Test
First, let's import scipy
from scipy import stats
Now let's check to see if our data-sets are normally distributed, so we know whether to use parametric or non-parametric tests to compare them. For this we will use the typical alpha,
Let's start with Japan.
s, p = stats.normaltest(temp_JP) # p = p-value
if p < 0.05:
  print('JP temperature data is not normal')
else:
  print('JP temperature data is normal')
JP temperature data is not normal
Now let's check China.
s, p = stats.normaltest(temp_CN) # p = p-value
if p < 0.05:
  print('CN temperature data is not normal')
else:
  print('CN temperature data is normal')
CN temperature data is not normal
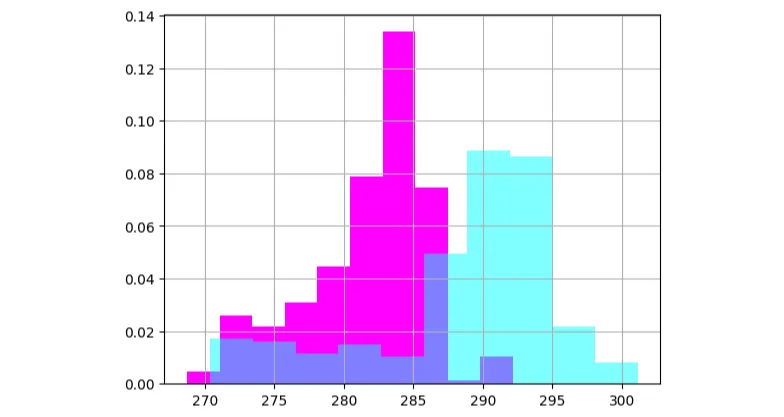
Let's plot the normalised histograms for the temperatures in Japan and China to look at this visually.
# plot histograms for temp_JP and temp_CN, make sure to set normed to True!
temp_JP.hist(color='magenta', density=True);
temp_CN.hist(color='cyan', alpha=0.5, density=True);

Wilcoxon-signed Rank Test
Our data is supposedly not following a normal distribution, so we may decide to use a non-parametric test. There is much to consider when selecting a test to use, but we will use the Wilcoxon-signed rank test.
Using scipy.stats.wilcoxon, conduct a pairwise comparison of temperatures from Japan to temperatures from China to see if the null hypothesis is rejected.
s, p = stats.wilcoxon(temp_JP[0:200], temp_CN[0:200])

if p < 0.05:
  print('null hypothesis rejected, significant difference between the data-sets')
else:
  print('null hypothesis accepted, no significant difference between the data-sets')
null hypothesis rejected, significant difference between the data-sets
Now, let's use a quick if statement to resolve whether the temperature in our China sample is greater than our Japan sample. We can make this claim now that we have checked the significance of our results.
if(temp_CN[0:200].mean() > temp_JP[0:200].mean()):
    print("Hypothesis 1 accepted, it is warmer in China")
else:
    print("Hypothesis 1 rejected, it is warmer in Japan")
Hypothesis 1 accepted, it is warmer in China
Exercise
Copy this notebook and try testing Hypothesis 2, make sure your decision to use parametric or non-parametric testing is justified.