Data Analysis with Rust Notebooks
A practical book on Data Analysis with Rust Notebooks that teaches you the concepts and how they’re implemented in practice.
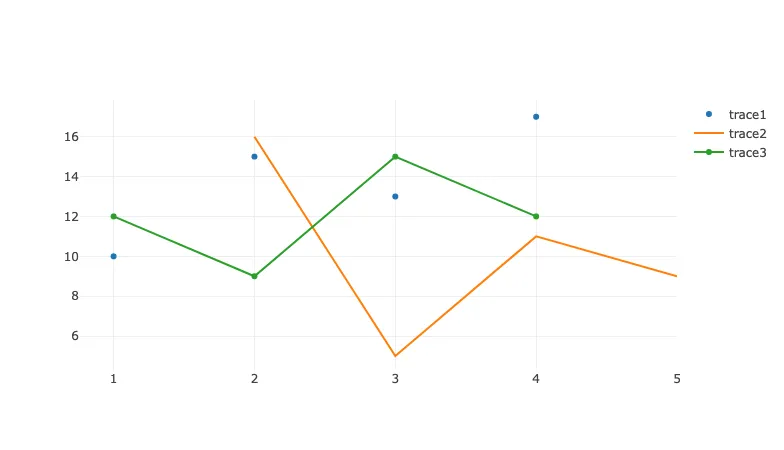
Get the bookdata analysis with rust notebooks Plotting with Plotly
How to embed Plotly visualisations in a Jupyter Notebook with a small workaround.

- Previous
- Plotting with Plotters
From the collection
Data Analysis with Rust Notebooks
A practical book on Data Analysis with Rust Notebooks that teaches you the concepts and how they’re implemented in practice.
Get the book
ISBN
978-1-915907-10-3
Cite
Rostami, S. (2020). Data Analysis with Rust Notebooks. Polyra Publishing.