Data Analysis with Rust Notebooks
A practical book on Data Analysis with Rust Notebooks that teaches you the concepts and how they’re implemented in practice.
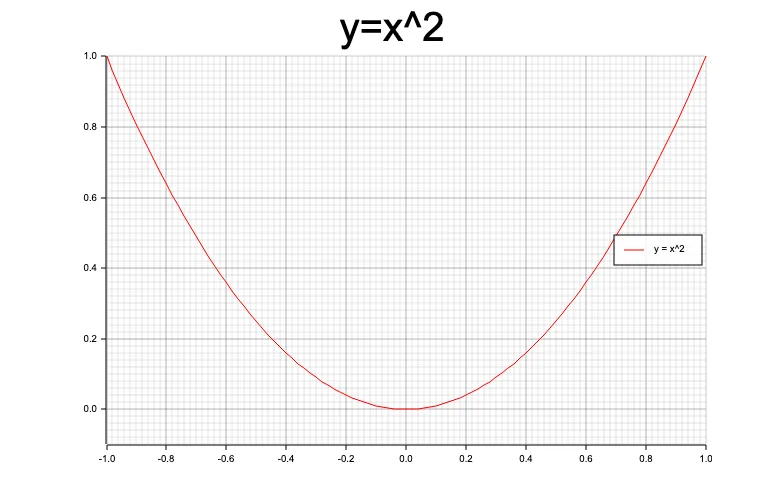
Get the bookdata analysis with rust notebooks Plotting with Plotters
I had originally planned to use Plotters for all the graphing in this book. However, shortly after finding Plotters, I found out that a Rust library had enabled Plotly support.

- Previous
- Setup Anaconda, Jupyter, and Rust
- Next
- Plotting with Plotly
From the collection
Data Analysis with Rust Notebooks
A practical book on Data Analysis with Rust Notebooks that teaches you the concepts and how they’re implemented in practice.
Get the book
ISBN
978-1-915907-10-3
Cite
Rostami, S. (2020). Data Analysis with Rust Notebooks. Polyra Publishing.