Preamble
:dep plotly = {version = "0.4.0"}
extern crate plotly;

use plotly::{Plot, Scatter};
use plotly::common::{Mode};
use std::fs;
Plotly for Visualisation
In my other book, Practical Evolutionary Algorithms, I relied on the Plotly graphic libraries to generate visualisations throughout each notebook. When I started writing Rust Notebooks a Plotly solution was not available, however, I found Plotters to be a suitable alternative for rendering visualisations. Less than 24 hours after making that decision, a plotting library for Rust powered by Plotly.js was posted on Reddit and caught my attention.
At the time of writing this section, there is no documented support for rendering within Jupyter Notebook cells, however, it is possible to use the .to_html() function to save to a HTML file, and then load and print that HTML file with Rust. We'll store this in a file named temp_plot.html.
let plotly_file = "temp_plot.html";
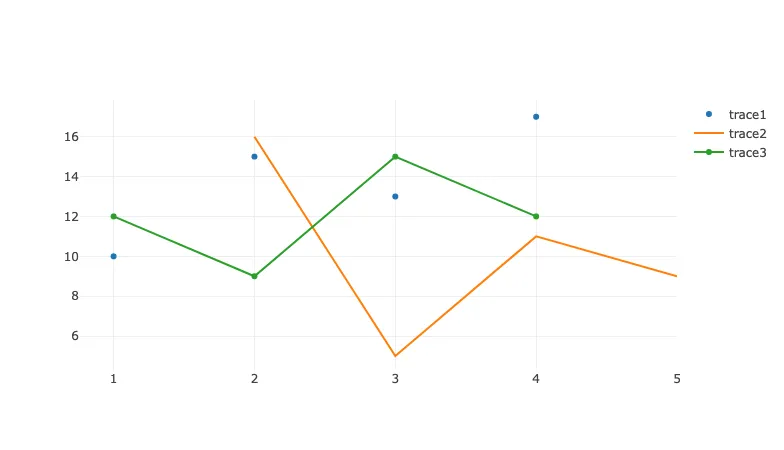
Let's demonstrate this with the first code example listed on the Plotly with Rust README.
let trace1 = Scatter::new(vec![1, 2, 3, 4], vec![10, 15, 13, 17])
    .name("trace1")
    .mode(Mode::Markers);

let trace2 = Scatter::new(vec![2, 3, 4, 5], vec![16, 5, 11, 9])
    .name("trace2")
    .mode(Mode::Lines);

let trace3 = Scatter::new(vec![1, 2, 3, 4], vec![12, 9, 15, 12]).name("trace3");

let mut plot = Plot::new();

plot.add_trace(trace1);
plot.add_trace(trace2);
plot.add_trace(trace3);
plot.to_html(plotly_file);
let plotly_contents = fs::read_to_string(plotly_file).unwrap();
Next, we will save this to a file using the .to_html() function, read it to plotly_contents using Rust, print it using println!(), and finally delete the file created by .to_html() as we don't need it after it is embedded.
plot.to_html(plotly_file);
let plotly_contents = fs::read_to_string(plotly_file).unwrap();
println!("EVCXR_BEGIN_CONTENT text/html\n{}\nEVCXR_END_CONTENT", plotly_contents);
fs::remove_file(plotly_file)?;
Conclusion
In this section we've demonstrated how to embed Plotly visualisations in a Jupyter Notebook with a small workaround. The only disadvantage to this solution that I've noticed is the large file size, e.g. this notebook weighs in at around 3.4MB. It could be that this feature is added to Plotly for Rust soon, or that it already exists and is just awaiting some documentation, but I'm happy with the solution so far.
Note
Since writing this section, Plotly for Rust is now able to display plots in output cells, such as those in Jupyter Lab with evcxr_display(). The approach described in these sections gives more control over the markup, template, and size of the page, which is pertinent when displaying multiple plots on a single page with the intention to export and share the generated HTML with interactive plots.

