
Preamble
import mne
import numpy as np                 # for multi-dimensional containers
import pandas as pd                # for DataFrames
import plotly.graph_objects as go  # for data visualisation
Dataset
Download sample data from Mike Cohen.
def load_data(tmin, tmax):
    epochs = mne.io.read_epochs_eeglab('sampleEEGdata.mat', verbose=False).crop(tmin, tmax)
    return epochs
Butterfly Plot of ERP from all sensors (all channels/all trials in time domain)
With MNE.Epochs.to_data_frame()
epochs = load_data(-0.2,1)
values = epochs.to_data_frame()
values = values.groupby("time").mean()
values.head()
| epoch | Fp1 | AF7 | AF3 | F1 | F3 | F5 | F7 | FT7 | FC5 | ... | CP4 | CP2 | P2 | P4 | P6 | P8 | P10 | PO8 | PO4 | O2 | |
|---|---|---|---|---|---|---|---|---|---|---|---|---|---|---|---|---|---|---|---|---|---|
| time | |||||||||||||||||||||
| -0.199219 | 49.0 | -0.891870 | -0.701918 | -1.706986 | -1.024161 | -0.976764 | -1.014164 | -1.002770 | -1.402991 | -1.496777 | ... | -1.511028 | -1.477739 | -1.723046 | -1.574034 | -1.598564 | -1.779448 | -0.940347 | -1.883280 | -1.808410 | -2.185663 |
| -0.195312 | 49.0 | 0.233510 | 0.506950 | -0.445840 | 0.333534 | 0.195593 | 0.212527 | 0.163632 | -0.052681 | -0.010986 | ... | 0.125678 | 0.130709 | 0.035723 | 0.130725 | 0.134243 | 0.357075 | 0.358627 | -0.038384 | -0.170933 | -0.259101 |
| -0.191406 | 49.0 | -0.507979 | -1.007955 | -0.986916 | -0.328037 | -0.593872 | -0.573180 | -0.562565 | -1.356027 | -0.634322 | ... | 0.207923 | 0.279907 | 0.127276 | 0.382046 | 0.444502 | 0.647713 | 0.310199 | 0.538165 | 0.387237 | 0.784565 |
| -0.187500 | 49.0 | -0.371972 | -0.792418 | 0.033578 | -0.341501 | -0.652673 | -0.620372 | -0.657750 | -1.051308 | -0.668186 | ... | -0.173513 | -0.230984 | -0.433561 | -0.238758 | -0.352948 | -0.364883 | 0.579337 | -0.249470 | -0.402957 | -0.453058 |
| -0.183594 | 49.0 | -0.152894 | -0.505432 | 1.171427 | 0.201709 | -0.251452 | -0.286700 | -0.341288 | -0.404997 | -0.500198 | ... | 0.178264 | 0.226898 | -0.141822 | 0.106690 | 0.067396 | -0.146313 | -0.080451 | 0.000498 | 0.049574 | 0.088095 |
5 rows × 65 columns
fig = go.Figure(layout=dict(xaxis=dict(title='time'),yaxis=dict(title='voltage')))

for ch in epochs.info['ch_names']:
    fig.add_scatter(x=epochs.times, y=values[ch], name=ch)

fig.show()
With MNE.Epochs.get_data()
epochs = load_data(-0.2,1)
values = epochs.get_data().mean(axis=0)
values = pd.DataFrame(np.transpose(values), columns=epochs.info['ch_names'])
values.head()
| Fp1 | AF7 | AF3 | F1 | F3 | F5 | F7 | FT7 | FC5 | FC3 | ... | CP4 | CP2 | P2 | P4 | P6 | P8 | P10 | PO8 | PO4 | O2 | |
|---|---|---|---|---|---|---|---|---|---|---|---|---|---|---|---|---|---|---|---|---|---|
| 0 | -8.918701e-07 | -7.019182e-07 | -1.706986e-06 | -1.024161e-06 | -9.767636e-07 | -1.014164e-06 | -1.002770e-06 | -1.402991e-06 | -1.496777e-06 | -1.314428e-06 | ... | -1.511028e-06 | -1.477739e-06 | -1.723046e-06 | -1.574034e-06 | -1.598564e-06 | -1.779448e-06 | -9.403469e-07 | -1.883280e-06 | -1.808410e-06 | -2.185663e-06 |
| 1 | 2.335097e-07 | 5.069503e-07 | -4.458401e-07 | 3.335338e-07 | 1.955928e-07 | 2.125266e-07 | 1.636316e-07 | -5.268077e-08 | -1.098647e-08 | 1.290634e-07 | ... | 1.256775e-07 | 1.307085e-07 | 3.572303e-08 | 1.307252e-07 | 1.342428e-07 | 3.570746e-07 | 3.586267e-07 | -3.838408e-08 | -1.709330e-07 | -2.591015e-07 |
| 2 | -5.079792e-07 | -1.007955e-06 | -9.869164e-07 | -3.280373e-07 | -5.938724e-07 | -5.731804e-07 | -5.625650e-07 | -1.356027e-06 | -6.343224e-07 | -3.839501e-07 | ... | 2.079225e-07 | 2.799072e-07 | 1.272755e-07 | 3.820456e-07 | 4.445024e-07 | 6.477130e-07 | 3.101987e-07 | 5.381648e-07 | 3.872367e-07 | 7.845649e-07 |
| 3 | -3.719716e-07 | -7.924181e-07 | 3.357842e-08 | -3.415010e-07 | -6.526729e-07 | -6.203719e-07 | -6.577504e-07 | -1.051308e-06 | -6.681859e-07 | -3.517596e-07 | ... | -1.735130e-07 | -2.309843e-07 | -4.335609e-07 | -2.387584e-07 | -3.529476e-07 | -3.648834e-07 | 5.793374e-07 | -2.494695e-07 | -4.029571e-07 | -4.530581e-07 |
| 4 | -1.528940e-07 | -5.054324e-07 | 1.171427e-06 | 2.017091e-07 | -2.514524e-07 | -2.866996e-07 | -3.412884e-07 | -4.049969e-07 | -5.001981e-07 | -6.876538e-09 | ... | 1.782636e-07 | 2.268977e-07 | -1.418217e-07 | 1.066895e-07 | 6.739592e-08 | -1.463131e-07 | -8.045127e-08 | 4.981451e-10 | 4.957422e-08 | 8.809529e-08 |
5 rows × 64 columns
fig = go.Figure(layout=dict(xaxis=dict(title='time')))

for ch in epochs.info['ch_names']:
    fig.add_scatter(x=epochs.times, y=values[ch], name=ch)

fig.show()
Topographical Variance
epochs = load_data(-0.2,1)
values = epochs.to_data_frame()
values = values.groupby("time").mean().var(axis=1)
fig = go.Figure(layout=dict(xaxis=dict(title='time'),yaxis=dict(autorange = True)))

fig.add_scatter(x=epochs.times, y=values, name=ch)

fig.show()
Plot of ERP from single sensor (single channel/mean of all trials in time domain)
With MNE.Epochs.to_data_frame()
epochs = load_data(-0.2,1)
values = epochs.to_data_frame(scalings=1e6)
values = values.groupby("time").mean()
values.head()
| epoch | Fp1 | AF7 | AF3 | F1 | F3 | F5 | F7 | FT7 | FC5 | ... | CP4 | CP2 | P2 | P4 | P6 | P8 | P10 | PO8 | PO4 | O2 | |
|---|---|---|---|---|---|---|---|---|---|---|---|---|---|---|---|---|---|---|---|---|---|
| time | |||||||||||||||||||||
| -0.199219 | 49.0 | -0.891870 | -0.701918 | -1.706986 | -1.024161 | -0.976764 | -1.014164 | -1.002770 | -1.402991 | -1.496777 | ... | -1.511028 | -1.477739 | -1.723046 | -1.574034 | -1.598564 | -1.779448 | -0.940347 | -1.883280 | -1.808410 | -2.185663 |
| -0.195312 | 49.0 | 0.233510 | 0.506950 | -0.445840 | 0.333534 | 0.195593 | 0.212527 | 0.163632 | -0.052681 | -0.010986 | ... | 0.125678 | 0.130709 | 0.035723 | 0.130725 | 0.134243 | 0.357075 | 0.358627 | -0.038384 | -0.170933 | -0.259101 |
| -0.191406 | 49.0 | -0.507979 | -1.007955 | -0.986916 | -0.328037 | -0.593872 | -0.573180 | -0.562565 | -1.356027 | -0.634322 | ... | 0.207923 | 0.279907 | 0.127276 | 0.382046 | 0.444502 | 0.647713 | 0.310199 | 0.538165 | 0.387237 | 0.784565 |
| -0.187500 | 49.0 | -0.371972 | -0.792418 | 0.033578 | -0.341501 | -0.652673 | -0.620372 | -0.657750 | -1.051308 | -0.668186 | ... | -0.173513 | -0.230984 | -0.433561 | -0.238758 | -0.352948 | -0.364883 | 0.579337 | -0.249470 | -0.402957 | -0.453058 |
| -0.183594 | 49.0 | -0.152894 | -0.505432 | 1.171427 | 0.201709 | -0.251452 | -0.286700 | -0.341288 | -0.404997 | -0.500198 | ... | 0.178264 | 0.226898 | -0.141822 | 0.106690 | 0.067396 | -0.146313 | -0.080451 | 0.000498 | 0.049574 | 0.088095 |
5 rows × 65 columns
fig = go.Figure(layout=dict(xaxis=dict(title='time'),yaxis=dict(title='voltage')))

fig.add_scatter(x=epochs.times, y=values.P1, name=ch)

fig.show()
With MNE.Epochs.get_data()
epochs = load_data(-0.2,1)
values = epochs.get_data().mean(axis=0)
values = pd.DataFrame(np.transpose(values), columns=epochs.info['ch_names'])
values.head()
| Fp1 | AF7 | AF3 | F1 | F3 | F5 | F7 | FT7 | FC5 | FC3 | ... | CP4 | CP2 | P2 | P4 | P6 | P8 | P10 | PO8 | PO4 | O2 | |
|---|---|---|---|---|---|---|---|---|---|---|---|---|---|---|---|---|---|---|---|---|---|
| 0 | -8.918701e-07 | -7.019182e-07 | -1.706986e-06 | -1.024161e-06 | -9.767636e-07 | -1.014164e-06 | -1.002770e-06 | -1.402991e-06 | -1.496777e-06 | -1.314428e-06 | ... | -1.511028e-06 | -1.477739e-06 | -1.723046e-06 | -1.574034e-06 | -1.598564e-06 | -1.779448e-06 | -9.403469e-07 | -1.883280e-06 | -1.808410e-06 | -2.185663e-06 |
| 1 | 2.335097e-07 | 5.069503e-07 | -4.458401e-07 | 3.335338e-07 | 1.955928e-07 | 2.125266e-07 | 1.636316e-07 | -5.268077e-08 | -1.098647e-08 | 1.290634e-07 | ... | 1.256775e-07 | 1.307085e-07 | 3.572303e-08 | 1.307252e-07 | 1.342428e-07 | 3.570746e-07 | 3.586267e-07 | -3.838408e-08 | -1.709330e-07 | -2.591015e-07 |
| 2 | -5.079792e-07 | -1.007955e-06 | -9.869164e-07 | -3.280373e-07 | -5.938724e-07 | -5.731804e-07 | -5.625650e-07 | -1.356027e-06 | -6.343224e-07 | -3.839501e-07 | ... | 2.079225e-07 | 2.799072e-07 | 1.272755e-07 | 3.820456e-07 | 4.445024e-07 | 6.477130e-07 | 3.101987e-07 | 5.381648e-07 | 3.872367e-07 | 7.845649e-07 |
| 3 | -3.719716e-07 | -7.924181e-07 | 3.357842e-08 | -3.415010e-07 | -6.526729e-07 | -6.203719e-07 | -6.577504e-07 | -1.051308e-06 | -6.681859e-07 | -3.517596e-07 | ... | -1.735130e-07 | -2.309843e-07 | -4.335609e-07 | -2.387584e-07 | -3.529476e-07 | -3.648834e-07 | 5.793374e-07 | -2.494695e-07 | -4.029571e-07 | -4.530581e-07 |
| 4 | -1.528940e-07 | -5.054324e-07 | 1.171427e-06 | 2.017091e-07 | -2.514524e-07 | -2.866996e-07 | -3.412884e-07 | -4.049969e-07 | -5.001981e-07 | -6.876538e-09 | ... | 1.782636e-07 | 2.268977e-07 | -1.418217e-07 | 1.066895e-07 | 6.739592e-08 | -1.463131e-07 | -8.045127e-08 | 4.981451e-10 | 4.957422e-08 | 8.809529e-08 |
5 rows × 64 columns
fig = go.Figure(layout=dict(xaxis=dict(title='time'),yaxis=dict(title='voltage')))

fig.add_scatter(x=epochs.times, y=values.P1, name=ch)

fig.show()
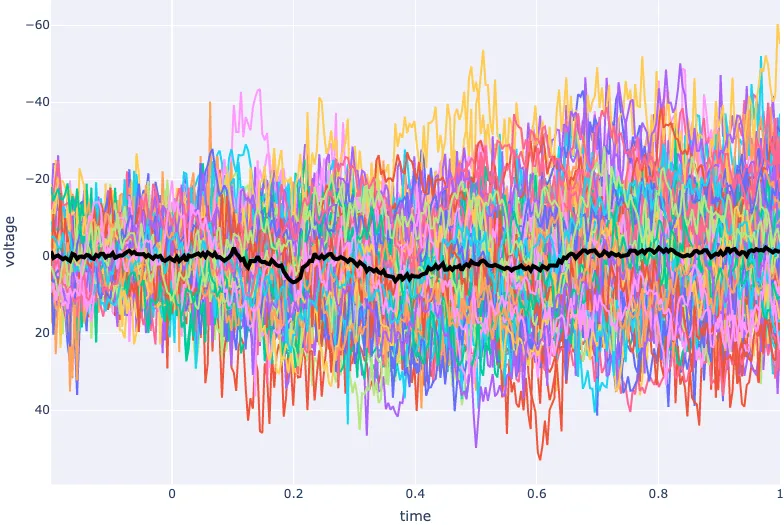
Plot of ERP on top of Butterfly Plot (single channel/all trials in time domain)
epochs = load_data(-0.2,1)
values = epochs.to_data_frame(picks='FCz')
erp = values.drop(['epoch'], axis=1).groupby("time").mean()
erp.head()
| FCz | |
|---|---|
| time | |
| -0.199219 | -1.281477 |
| -0.195312 | 0.452928 |
| -0.191406 | 0.060128 |
| -0.187500 | -0.171168 |
| -0.183594 | 0.338981 |
fig = go.Figure(layout=dict(xaxis=dict(title='time'),yaxis=dict(title='voltage')))

for epoch in values['epoch'].unique():
    epoch_values = values[values['epoch'] == epoch]
    fig.add_scatter(x=epochs.times, y=epoch_values.FCz, name=f'epoch {epoch}')

fig.add_scatter(x=epochs.times, y=erp.FCz, name=f'ERP', line=dict(color='black', width=4))

fig.update_layout(showlegend=False)
fig.show()