Data Analysis with Rust Notebooks
A practical book on Data Analysis with Rust Notebooks that teaches you the concepts and how they’re implemented in practice.
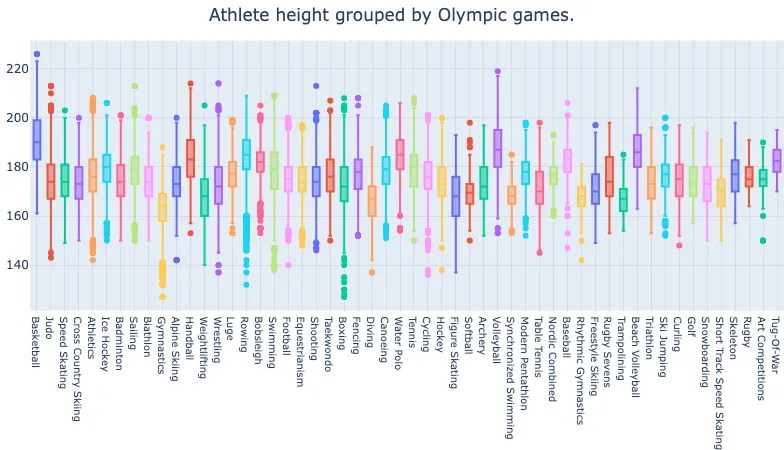
Get the bookdata analysis with rust notebooks Box Plots at the Olympics
We work towards illustrating the age and height of athletes grouped by games in the 120 years of Olympic history.

- Next
- Preface
From the collection
Data Analysis with Rust Notebooks
A practical book on Data Analysis with Rust Notebooks that teaches you the concepts and how they’re implemented in practice.
Get the book
ISBN
978-1-915907-10-3
Cite
Rostami, S. (2020). Data Analysis with Rust Notebooks. Polyra Publishing.