Data is Beautiful

A practical book on data visualisation that shows you how to create static and interactive visualisations that are engaging and beautiful.
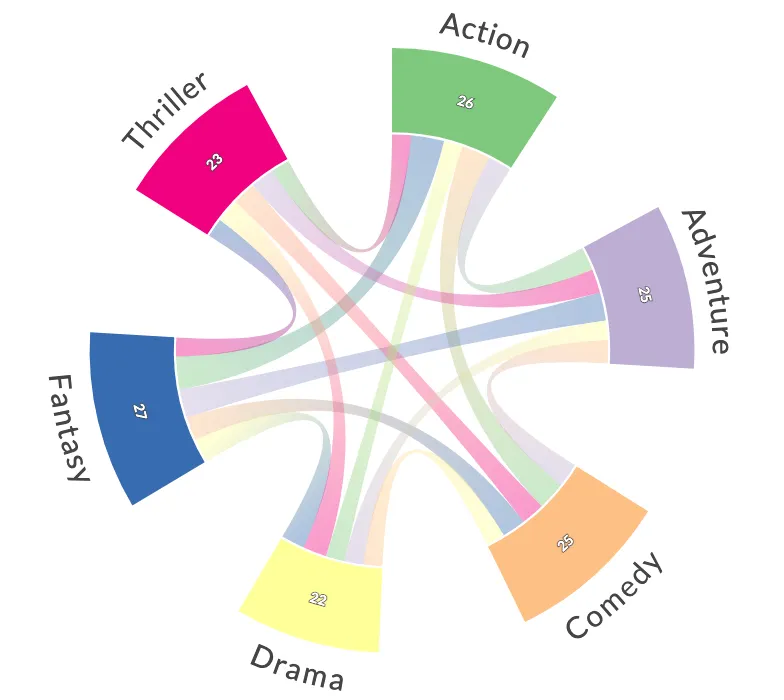
Get the book
Advanced Features For Chord Diagrams

Preamble

from plotapi import Chord

Introduction

Note

This document is best viewed online where the interactivity of the demonstrations can be experienced.

In a chord diagram (or radial network), entities are arranged radially as segments with their relationships visualised by arcs that connect them. The size of the segments illustrates the numerical proportions, whilst the size of the arc illustrates the significance of the relationships1. Chord diagrams are useful when trying to convey relationships between different entities, and they can be beautiful and eye-catching.

Get PlotAPI for Chord Diagrams

Click here to get access to the full-featured chord visualization API, producing beautiful interactive visualizations, e.g. those featured on the front page of Reddit.

PlotAPI Chord

License

To use the full-featured plotapi package, you need to assign a valid license key. This can be purchased here.

Chord.api_key("your-api-key")

We'll use the following data for the co-occurrence matrix and names parameters until we cover divided diagrams.

matrix = [
    [0, 5, 6, 4, 7, 4],
    [5, 0, 5, 4, 6, 5],
    [6, 5, 0, 4, 5, 5],
    [4, 4, 4, 0, 5, 5],
    [7, 6, 5, 5, 0, 4],
    [4, 5, 5, 5, 4, 0],
]

names = ["Action", "Adventure", "Comedy", "Drama", "Fantasy", "Thriller"]

Defaults

Without passing in any arguments for the customisation parameters, the output will use the default value.

Chord(matrix, names)
PlotAPI - Chord Diagram

Outputs Methods

Chord Pro supports the following outputs.

HTML to Jupyer Lab Cell (Interactive)

Outputs the interactive diagram to a Jupyter Lab cell.

Chord(matrix, names)
PlotAPI - Chord Diagram

HTML to file (Interactive)

Saves an interactive HTML file locally.

Chord(matrix, names).to_html("out.html")

PNG to Jupyer Lab Cell (Image)

Outputs a PNG to a Jupyter Lab Cell.

Chord(matrix, names).show_png()
Notebook PNG image

PNG to file (image)

Saves a PNG file locally.

Chord(matrix, names).to_png("out.png")

PDF to file

Saves a PDF file locally.

Chord(matrix, names).to_pdf("out.pdf")

Disable SSL Verification

Chord.verify_ssl(True) Some users behind school/corporate networks may experience issues contacting the Chord API end-points. One workaround is to use Chord.verify_ssl(False). You will receive an InsecureRequestWarning with a link to further information.

Chord.verify_ssl(False)
Chord(matrix, names, title="SSL Verification Disabled")
PlotAPI - Chord Diagram

Chord Colours

colors="rainbow"

You can select a color scheme from the following: ['league', 'monsters', 'movies', 'category10', 'accent', 'dark2', 'paired', 'pastel1', 'pastel2', 'set1', 'set2', 'set3', 'tableau10', 'rainbow', 'sinebow', 'yellow_red', 'yellow_brown', 'yellow_green', 'yellow_blue', 'red_purple', 'purple_red', 'purple_blue', 'orange_red', 'green_blue', 'blue_purple', 'blue_green', 'cubehelix', 'cool', 'warm', 'cividis', 'plasma', 'magma', 'inferno', 'viridis', 'turbo', 'brown_green', 'purple_green', 'pink_green', 'red_blue', 'red_grey', 'red_yellow_blue', 'red_yellow_green', 'spectral', 'blues', 'greens', 'greys', 'oranges', 'purples', 'reds']

Chord(matrix, names, colors="league")
PlotAPI - Chord Diagram

The colors parameter also accepts a Python list of HEX colour codes.

grayscale = [
    "#222222",
    "#333333",
    "#4c4c4c",
    "#666666",
    "#848484",
    "#9a9a9a",
]

Chord(matrix, names, colors=grayscale)
PlotAPI - Chord Diagram

Opacity

opacity=0.8

This sets the opacity for the arcs when they are not selected (mouseover/touch).

Chord(matrix, names, opacity=0.2)
PlotAPI - Chord Diagram

Reverse Gradients

opacity=0.8

This sets the direction of the arc gradients.

Chord(matrix, names, reverse_gradients=True)
PlotAPI - Chord Diagram

Arc Numbers

arc_numbers=False

This sets the visibility of quantity labels on segments.

Chord(matrix, names, arc_numbers=True)
PlotAPI - Chord Diagram

Diagram Title

titles=""

This sets the text and visibility of the diagram title.

Chord(matrix, names, title="Movie Genre Co-occurrence")
PlotAPI - Chord Diagram

Padding

padding=0.01

This sets the padding between segments as a fraction of the circle.

Chord(matrix, names, padding=0.5)
PlotAPI - Chord Diagram

Width

width=700

This sets the width (and height) of the chord diagram.

Chord(matrix, names, width=400)
PlotAPI - Chord Diagram

Rotation

rotate=0

This sets the rotation of the chord diagram.

Chord(matrix, names, rotate=-30)
PlotAPI - Chord Diagram

Radius Scales

inner_radius_scale=0.45, outer_radius_scale=1.1,

This sets the inner and outer radius scale of the chord diagram.

Chord(matrix, names, inner_radius_scale=0.3, outer_radius_scale=1.5)
PlotAPI - Chord Diagram

Label Color

label_colors="#454545"

This sets the label colour. It can be a string or a list of strings.

Chord(matrix, names, label_colors="#B362FF")
PlotAPI - Chord Diagram

Curved Labels

curved_labels=False

This turns curved labels on or off. It's not suitable for diagrams with many segments, but sometimes it can improve the look.

Chord(matrix, names, curved_labels=True)
PlotAPI - Chord Diagram

Label Wrapping

wrap_labels=True

This turns label wrapping on or off. It's on by default.

Let's temporarily change our names data to demonstrate this.

names = [
    "Exciting Action",
    "Fun Adventure",
    "Hilarious Comedy",
    "Drama",
    "Fantasy",
    "Chilling Thriller",
]
Chord(matrix, names)
PlotAPI - Chord Diagram

Now to demonstrate label wrapping set to disabled.

Chord(matrix, names, wrap_labels=False)
PlotAPI - Chord Diagram

We'll restore our names data before we continue.

names = ["Action", "Adventure", "Comedy", "Drama", "Fantasy", "Thriller"]

Margins

margin=100

This sets the chord diagram margin.

Chord(matrix, names, margin=200)
PlotAPI - Chord Diagram

Font-size

font_size="16px" font_size_large="20px"

This sets the font-size for two views, font-size-large (@media min-width: 600px), otherwise font-size. Setting a large font-size may require adjustment of the margin parameter to avoid text-clipping.

Chord(matrix, names, font_size="20px", font_size_large="30px")
PlotAPI - Chord Diagram

popup_width=350

This sets the max-width of the popup.

Chord(matrix, names, popup_width=150)
PlotAPI - Chord Diagram

conjunction="and" verb="occur together in" noun="instances"

These change parts of the popup text:

Default popup text

e.g. we could change it to:

Modified popup text

Chord(
    matrix,
    names,
    conjunction="&",
    verb="appear together in",
    noun="cases",
)
PlotAPI - Chord Diagram

Symmetric and Asymmetric Diagrams

symmetric=True

This turns the symmetric mode on or off. The primary support is for symmetric diagrams, but there is some support for asymmetric ones.

For example, this will update the popup text to reflect the asymmetry of relationships.

Asymmetric mode popup text

matrix = [
    [0, 5, 3, 4, 7, 3],
    [2, 0, 6, 5, 2, 7],
    [6, 3, 0, 4, 5, 7],
    [8, 3, 4, 0, 4, 7],
    [2, 8, 6, 7, 0, 4],
    [5, 3, 3, 4, 2, 0],
]

Chord(matrix, names, symmetric=False)
PlotAPI - Chord Diagram