Preamble
:dep plotapi = {Version = "0.1.1"}

use plotapi::{Visualisation, Params, params;
Note
This introduction to PlotAPI was quickly put together to enable users to get started. You can see the most up-to-date API documentation at https://plotapi.com/redoc. It requires a license - so you can skip this section if it's not of interest!
What is PlotAPI?
PlotAPI is software that enables you to turn your data into engaging, beautiful, and interactive plots.
The power of PlotAPI can be accessed directly through the API if you're a coder, or using our friendly APP if you prefer not to code.
Plots can be saved in many formats:
- Interactive
HTML - Animated video
MP4 - Static image
PNGandSVG - Document
PDF
They can even be uploaded to the Cloud and shared publicly, privately, or within your Team.
Use the API or the APP
PlotAPI is designed to be "Beautiful by Default".
This means a head-turning visualisation is only a single click or single line of code away.

Single line of code with the API
Access the power of PlotAPI directly from your code with the API.
Simply load your data in your source file or notebook, and pass it into one of the plot types.
Chord Diagrams with the Rich Hover Box
The Dataset
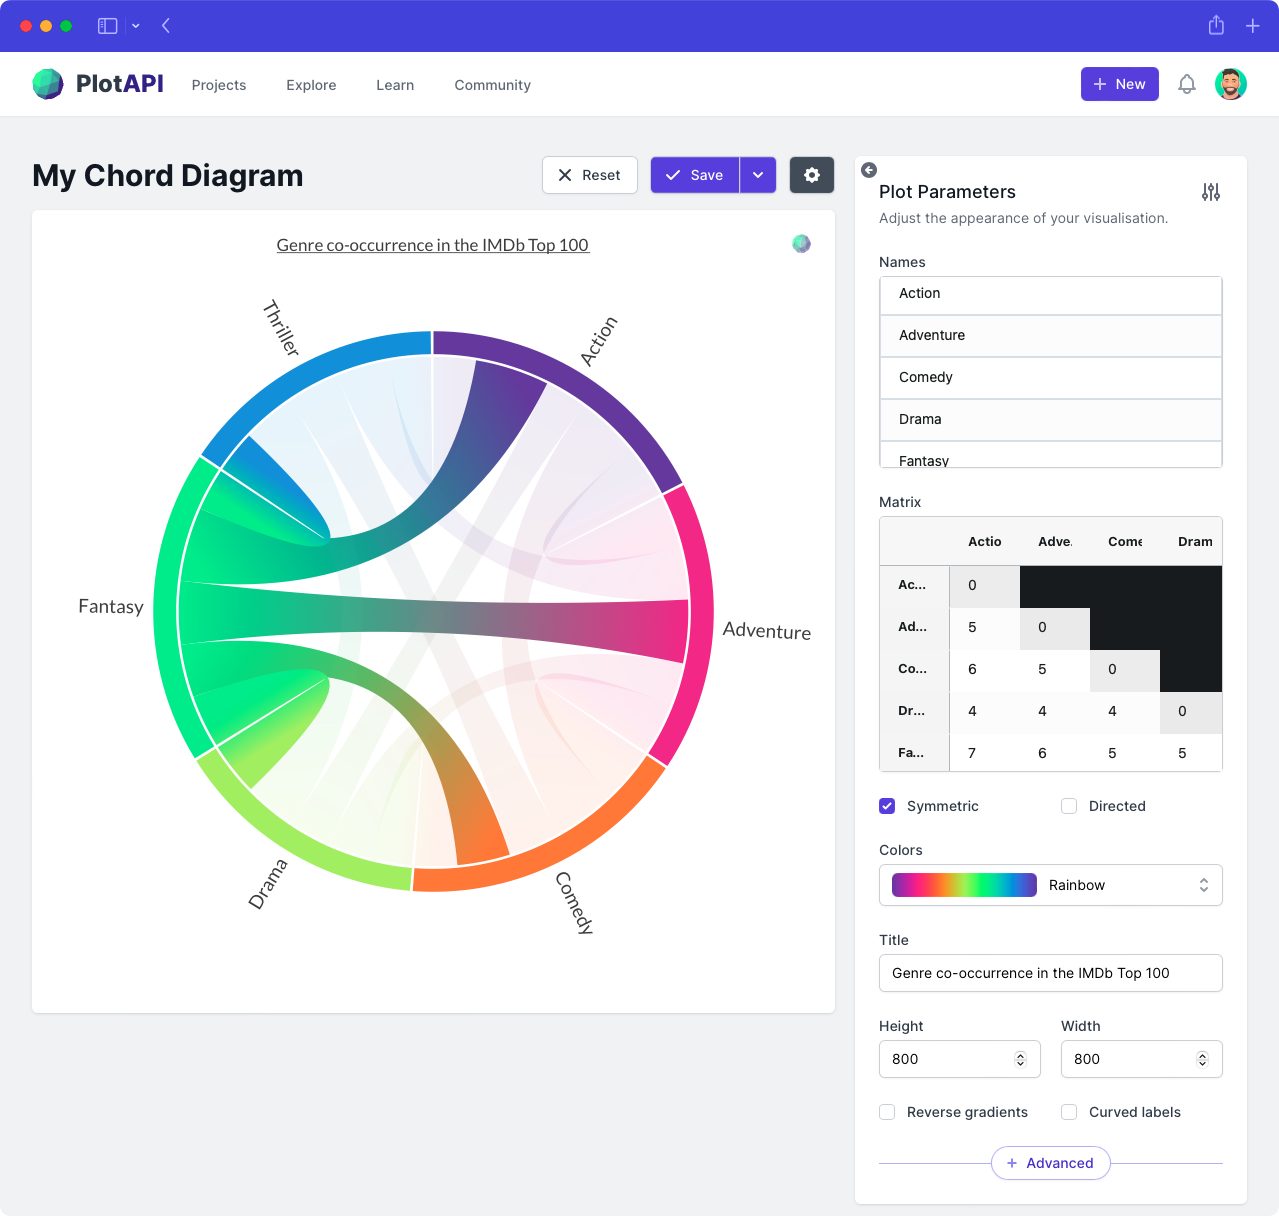
The focus for this section will be the demonstration of the Chord visualisation from PlotAPI. To keep it simple, we will use synthetic data that illustrates the co-occurrences between movie genres within the same movie.
let matrix: Vec<Vec<f64>> = vec![
    vec![0., 5., 6., 4., 7., 4.],
    vec![5., 0., 5., 4., 6., 5.],
    vec![6., 5., 0., 4., 5., 5.],
    vec![4., 4., 4., 0., 5., 5.],
    vec![7., 6., 5., 5., 0., 4.],
    vec![4., 5., 5., 5., 4., 0.],
];

let names: Vec<String> = vec![
    "Action",
    "Adventure",
    "Comedy",
    "Drama",
    "Fantasy",
    "Thriller",
]
.into_iter()
.map(String::from)
.collect();
In a simple chord diagram, only the matrix and names parameters are required to create a chord diagram. With the details_thumbs parameter we can associate corresponding thumbnails with each details entry. These enable the rich hover boxes.
let details : Vec<Vec<Vec<String>>> = vec![
    vec![vec![], vec!["Movie 1".to_string(),"Movie 2".to_string()], vec!["Movie 3".to_string(),"Movie 4".to_string(),"Movie 5".to_string()], vec!["Movie 6".to_string(),"Movie 7".to_string()], vec!["Movie 8".to_string(),"Movie 9".to_string(),"Movie 10".to_string(),"Movie 11".to_string()], vec!["Movie 12".to_string()]],
    vec![vec!["Movie 13".to_string(),"Movie 14".to_string()], vec![], vec!["Movie 15".to_string(),"Movie 16".to_string()], vec!["Movie 17".to_string()], vec!["Movie 18".to_string(),"Movie 19".to_string(),"Movie 20".to_string()], vec!["Movie 21".to_string(),"Movie 22".to_string()]],
    vec![vec!["Movie 23".to_string(),"Movie 24".to_string(),"Movie 25".to_string()], vec!["Movie 26".to_string(),"Movie 27".to_string()], vec![], vec!["Movie 28".to_string()], vec!["Movie 29".to_string(),"Movie 30".to_string()], vec!["Movie 31".to_string(),"Movie 32".to_string()]],
    vec![vec!["Movie 33".to_string()], vec!["Movie 34".to_string()], vec!["Movie 35".to_string()], vec![], vec!["Movie 36".to_string(),"Movie 37".to_string()], vec!["Movie 38".to_string(),"Movie 39".to_string()]],
    vec![vec!["Movie 40".to_string(),"Movie 41".to_string(),"Movie 42".to_string(),"Movie 43".to_string()], vec!["Movie 44".to_string(),"Movie 45".to_string(),"Movie 46".to_string()], vec!["Movie 47".to_string(),"Movie 48".to_string()], vec!["Movie 49".to_string(),"Movie 50".to_string()], vec![], vec!["Movie 51".to_string()]],
    vec![vec!["Movie 52".to_string()], vec!["Movie 53".to_string(),"Movie 54".to_string()], vec!["Movie 55".to_string(),"Movie 56".to_string()], vec!["Movie 57".to_string(),"Movie 58".to_string()], vec!["Movie 59".to_string()], vec![]]
];
let details_thumbs : Vec<Vec<Vec<String>>> = vec![
    vec![vec![], vec!["https://datacrayon.com/datasets/pp_img/3.png".to_string(),"https://datacrayon.com/datasets/pp_img/3.png".to_string()], vec!["https://datacrayon.com/datasets/pp_img/3.png".to_string(),"https://datacrayon.com/datasets/pp_img/3.png".to_string(),"https://datacrayon.com/datasets/pp_img/3.png".to_string()], vec!["https://datacrayon.com/datasets/pp_img/3.png".to_string(),"https://datacrayon.com/datasets/pp_img/3.png".to_string()], vec!["https://datacrayon.com/datasets/pp_img/3.png".to_string(),"https://datacrayon.com/datasets/pp_img/3.png".to_string(),"https://datacrayon.com/datasets/pp_img/3.png".to_string(),"https://datacrayon.com/datasets/pp_img/3.png".to_string()], vec!["https://datacrayon.com/datasets/pp_img/3.png".to_string()]],
    vec![vec!["https://datacrayon.com/datasets/pp_img/3.png".to_string(),"https://datacrayon.com/datasets/pp_img/3.png".to_string()], vec![], vec!["https://datacrayon.com/datasets/pp_img/3.png".to_string(),"https://datacrayon.com/datasets/pp_img/3.png".to_string()], vec!["https://datacrayon.com/datasets/pp_img/3.png".to_string()], vec!["https://datacrayon.com/datasets/pp_img/3.png".to_string(),"https://datacrayon.com/datasets/pp_img/3.png".to_string(),"https://datacrayon.com/datasets/pp_img/3.png".to_string()], vec!["https://datacrayon.com/datasets/pp_img/3.png".to_string(),"https://datacrayon.com/datasets/pp_img/3.png".to_string()]],
    vec![vec!["https://datacrayon.com/datasets/pp_img/3.png".to_string(),"https://datacrayon.com/datasets/pp_img/3.png".to_string(),"https://datacrayon.com/datasets/pp_img/3.png".to_string()], vec!["https://datacrayon.com/datasets/pp_img/3.png".to_string(),"https://datacrayon.com/datasets/pp_img/3.png".to_string()], vec![], vec!["https://datacrayon.com/datasets/pp_img/3.png".to_string()], vec!["https://datacrayon.com/datasets/pp_img/3.png".to_string(),"https://datacrayon.com/datasets/pp_img/3.png".to_string()], vec!["https://datacrayon.com/datasets/pp_img/3.png".to_string(),"https://datacrayon.com/datasets/pp_img/3.png".to_string()]],
    vec![vec!["https://datacrayon.com/datasets/pp_img/3.png".to_string()], vec!["https://datacrayon.com/datasets/pp_img/3.png".to_string()], vec!["https://datacrayon.com/datasets/pp_img/3.png".to_string()], vec![], vec!["https://datacrayon.com/datasets/pp_img/3.png".to_string(),"https://datacrayon.com/datasets/pp_img/3.png".to_string()], vec!["https://datacrayon.com/datasets/pp_img/3.png".to_string(),"https://datacrayon.com/datasets/pp_img/3.png".to_string()]],
    vec![vec!["https://datacrayon.com/datasets/pp_img/3.png".to_string(),"https://datacrayon.com/datasets/pp_img/3.png".to_string(),"https://datacrayon.com/datasets/pp_img/3.png".to_string(),"https://datacrayon.com/datasets/pp_img/3.png".to_string()], vec!["https://datacrayon.com/datasets/pp_img/3.png".to_string(),"https://datacrayon.com/datasets/pp_img/3.png".to_string(),"https://datacrayon.com/datasets/pp_img/3.png".to_string()], vec!["https://datacrayon.com/datasets/pp_img/3.png".to_string(),"https://datacrayon.com/datasets/pp_img/3.png".to_string()], vec!["https://datacrayon.com/datasets/pp_img/3.png".to_string(),"https://datacrayon.com/datasets/pp_img/3.png".to_string()], vec![], vec!["https://datacrayon.com/datasets/pp_img/3.png".to_string()]],
    vec![vec!["https://datacrayon.com/datasets/pp_img/3.png".to_string()], vec!["https://datacrayon.com/datasets/pp_img/3.png".to_string(),"https://datacrayon.com/datasets/pp_img/3.png".to_string()], vec!["https://datacrayon.com/datasets/pp_img/3.png".to_string(),"https://datacrayon.com/datasets/pp_img/3.png".to_string()], vec!["https://datacrayon.com/datasets/pp_img/3.png".to_string(),"https://datacrayon.com/datasets/pp_img/3.png".to_string()], vec!["https://datacrayon.com/datasets/pp_img/3.png".to_string()], vec![]],
];
Let's see what the chord visualisation produces when we invoke the show() method.
Visualisation {
    api_key: your_api_key,
    endpoint: "chord",
    params: params!({
        "matrix": matrix,
        "names": names,
        "details": details,
        "details_thumbs": details_thumbs,
        "curved_labels": true
    })
}.show();
Split Chord Diagrams
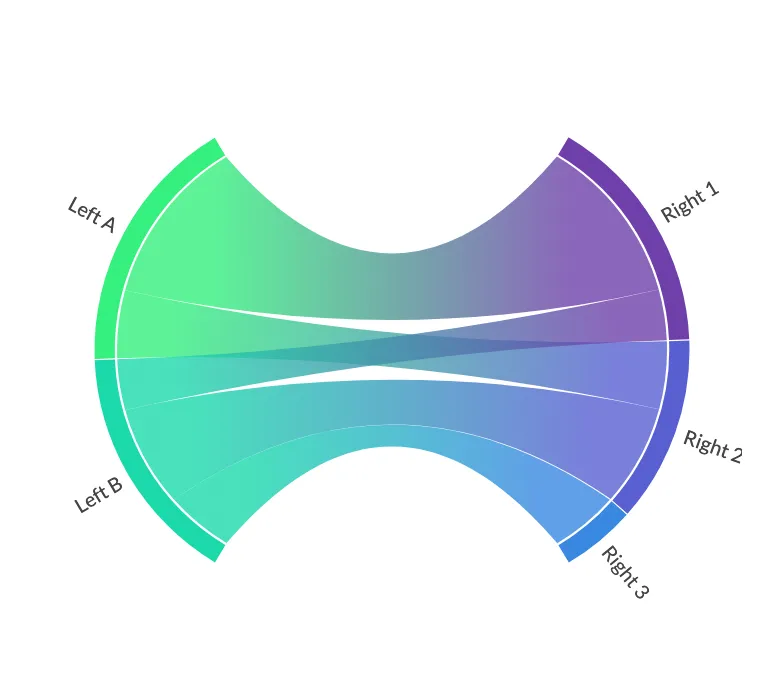
PlotAPI SplitChord expects:
-
links: Alistofdictitems, these will define the flow between asourceand atarget. -
nodes: Alistofdictitems, these will configure the nodes, e.g. specifying whichgroup(left or right) they belong to.
let links = params!([
    {"source": "Left A", "target": "Right 1", "value": 10},
    {"source": "Right 2", "target": "Left A", "value": 4},
    {"source": "Left B", "target": "Right 1", "value": 3},
    {"source": "Left B", "target": "Right 2", "value": 6},
    {"source": "Left B", "target": "Right 3", "value": 4},
]);

let nodes = params!([
    {"name": "Left A", "group": "left"},
    {"name": "Left B", "group": "left"},
    {"name": "Right 1", "group": "right"},
    {"name": "Right 2", "group": "right"},
    {"name": "Right 3", "group": "right"},
]);
Creating our first Split Chord Diagram is as easy as calling PlotAPI with our two inputs.
Be sure to interact with the visualisation to see what the default settings can do!
Visualisation {
    api_key: your_api_key,
    endpoint: "splitchord",
    params: params!({
        "links": links,
        "nodes": nodes,
        "colors": "cool"
    })
}.show();
Conclusion
In this section, we've introduced PlotAPI and used synthetic data to demonstrate two of its visualisations. More information on PlotAPI is available on the website and docs.
-
Tintarev, N., Rostami, S., & Smyth, B. (2018, April). Knowing the unknown: visualising consumption blind-spots in recommender systems. In Proceedings of the 33rd Annual ACM Symposium on Applied Computing (pp. 1396-1399). ↩

