Data Analysis with Rust Notebooks
A practical book on Data Analysis with Rust Notebooks that teaches you the concepts and how they’re implemented in practice.
Get the bookdata analysis with rust notebooks Finishing Touches for Visualisation
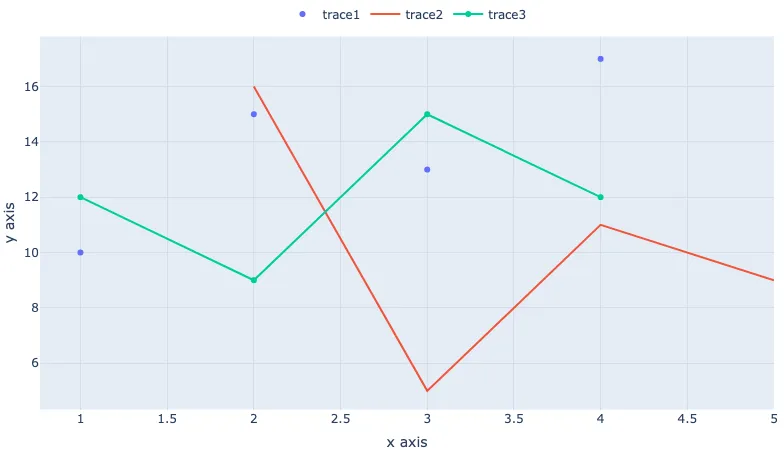
Let's take our Plotly workaround a step further to its final destination - a reusable function that we can use throughout our analyses.

From the collection
Data Analysis with Rust Notebooks
A practical book on Data Analysis with Rust Notebooks that teaches you the concepts and how they’re implemented in practice.
Get the book
ISBN
978-1-915907-10-3
Cite
Rostami, S. (2020). Data Analysis with Rust Notebooks. Polyra Publishing.