Preamble
:dep darn = {version = "0.3.4"}
:dep ndarray = {version = "0.13.1"}
:dep itertools = {version = "0.9.0"}
:dep plotly = {version = "0.4.0"}
extern crate ndarray;

use ndarray::prelude::*;
use std::str::FromStr;
use itertools::Itertools;
use plotly::{Plot, Layout, BoxPlot};
use plotly::common::{Title, Font};
use plotly::layout::{Margin, Axis};
Introduction
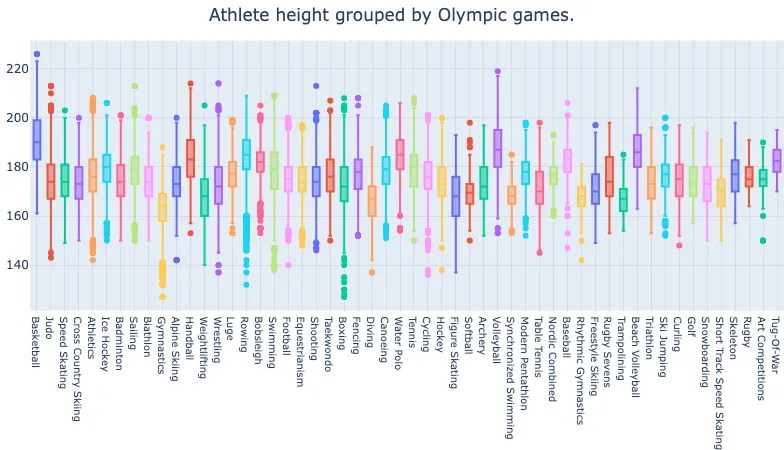
In this section, we're going to use 120 years of Olympic history to create two visualisations. Let's set our sights on something that illustrates the age and height in athletes grouped by the different Olympic games.

The Dataset
We'll use the 120 years of Olympic history: athletes and results dataset, which we'll download and load with the darn crate. You're also welcome to use the mirrored that has been used in the following cell.
let data = darn::read_csv("https://datacrayon.com/datasets/athlete_events_known_age.csv");
We'll take a peek at what we've downloaded to make sure there were no issues with the loading.
darn::show_frame(&data.0, Some(&data.1));
| ID | Name | Sex | Age | Height | Weight | Team | NOC | Games | Year | Season | City | Sport | Event | Medal |
|---|---|---|---|---|---|---|---|---|---|---|---|---|---|---|
| "1" | "A Dijiang" | "M" | "24" | "180" | "80" | "China" | "CHN" | "1992 Summer" | "1992" | "Summer" | "Barcelona" | "Basketball" | "Basketball Men's Basketball" | "NA" |
| "2" | "A Lamusi" | "M" | "23" | "170" | "60" | "China" | "CHN" | "2012 Summer" | "2012" | "Summer" | "London" | "Judo" | "Judo Men's Extra-Lightweight" | "NA" |
| "5" | "Christine Jacoba Aaftink" | "F" | "21" | "185" | "82" | "Netherlands" | "NED" | "1988 Winter" | "1988" | "Winter" | "Calgary" | "Speed Skating" | "Speed Skating Women's 500 metres" | "NA" |
| "5" | "Christine Jacoba Aaftink" | "F" | "21" | "185" | "82" | "Netherlands" | "NED" | "1988 Winter" | "1988" | "Winter" | "Calgary" | "Speed Skating" | "Speed Skating Women's 1,000 metres" | "NA" |
| "5" | "Christine Jacoba Aaftink" | "F" | "25" | "185" | "82" | "Netherlands" | "NED" | "1992 Winter" | "1992" | "Winter" | "Albertville" | "Speed Skating" | "Speed Skating Women's 500 metres" | "NA" |
| ... | ... | ... | ... | ... | ... | ... | ... | ... | ... | ... | ... | ... | ... | ... |
| "135569" | "Andrzej ya" | "M" | "29" | "179" | "89" | "Poland-1" | "POL" | "1976 Winter" | "1976" | "Winter" | "Innsbruck" | "Luge" | "Luge Mixed (Men)'s Doubles" | "NA" |
| "135570" | "Piotr ya" | "M" | "27" | "176" | "59" | "Poland" | "POL" | "2014 Winter" | "2014" | "Winter" | "Sochi" | "Ski Jumping" | "Ski Jumping Men's Large Hill, Individual" | "NA" |
| "135570" | "Piotr ya" | "M" | "27" | "176" | "59" | "Poland" | "POL" | "2014 Winter" | "2014" | "Winter" | "Sochi" | "Ski Jumping" | "Ski Jumping Men's Large Hill, Team" | "NA" |
| "135571" | "Tomasz Ireneusz ya" | "M" | "30" | "185" | "96" | "Poland" | "POL" | "1998 Winter" | "1998" | "Winter" | "Nagano" | "Bobsleigh" | "Bobsleigh Men's Four" | "NA" |
| "135571" | "Tomasz Ireneusz ya" | "M" | "34" | "185" | "96" | "Poland" | "POL" | "2002 Winter" | "2002" | "Winter" | "Salt Lake City" | "Bobsleigh" | "Bobsleigh Men's Four" | "NA" |
It looks like the data was loaded without any issues.
Data Wrangling
Let's assign the feature data to games and feature names to headers for readability.
let games = data.0;
let headers = data.1;
A quick look at the available features will give us the feature names we're after for the age and height of athletes.
println!("{}", &headers.iter().format("\n"));
ID
Name
Sex
Age
Height
Weight
Team
NOC
Games
Year
Season
City
Sport
Event
Medal
We've confirmed that the two features we're after are named Age and Height, and that they're at index
let idx_age = headers.iter().position(|x| x == "Age").unwrap();
let idx_height = headers.iter().position(|x| x == "Height").unwrap();
Let's create an array of these indices and print them out to check.
let selected_features = [idx_age,idx_height];

println!("{}",selected_features.iter().format("\n"));
Now that we know the index of our age and height columns, let's prepare two collection variables, one named features to hold the numeric feature data, and one named feature_headers to hold the corresponding column names.
let mut features: Array2::<f32> =  Array2::<f32>::zeros((games.shape()[0],0));
let mut feature_headers = Vec::<String>::new();
3
4
Now, we can copy and parse our feature data into initialised collections.
for &feature_index in selected_features.iter() {
    feature_headers.push(headers[feature_index].clone());
    features = ndarray::stack![Axis(1), features,
        games.column(feature_index as usize)
            .mapv(|elem| elem.parse::<f32>().unwrap())
            .insert_axis(Axis(1))
    ];
};
We'll take a peek to make sure there were no obvious issues with parsing.
darn::show_frame(&features, Some(&feature_headers));
| Age | Height |
|---|---|
| 24.0 | 180.0 |
| 23.0 | 170.0 |
| 21.0 | 185.0 |
| 21.0 | 185.0 |
| 25.0 | 185.0 |
| ... | ... |
| 29.0 | 179.0 |
| 27.0 | 176.0 |
| 27.0 | 176.0 |
| 30.0 | 185.0 |
| 34.0 | 185.0 |
Looking good. Next, we'll need to determine the different games available in our dataset - we'll be using these to group the age and height data.
let idx_sport = headers.iter().position(|x| x == "Sport").unwrap();
let unique_games = games.column(idx_sport).iter().cloned().unique().collect_vec();

println!("{}",unique_games.iter().format(", "));
Basketball, Judo, Speed Skating, Cross Country Skiing, Athletics, Ice Hockey, Badminton, Sailing, Biathlon, Gymnastics, Alpine Skiing, Handball, Weightlifting, Wrestling, Luge, Rowing, Bobsleigh, Swimming, Football, Equestrianism, Shooting, Taekwondo, Boxing, Fencing, Diving, Canoeing, Water Polo, Tennis, Cycling, Hockey, Figure Skating, Softball, Archery, Volleyball, Synchronized Swimming, Modern Pentathlon, Table Tennis, Nordic Combined, Baseball, Rhythmic Gymnastics, Freestyle Skiing, Rugby Sevens, Trampolining, Beach Volleyball, Triathlon, Ski Jumping, Curling, Golf, Snowboarding, Short Track Speed Skating, Skeleton, Rugby, Art Competitions, Tug-Of-War
We now have the unique list of Olympic games - some of which you may not even have heard of!
Visualising the Data
Now that we have prepared our data, let's use all of our hard work in a box plot test.
Height of Athletes in Basketball
Let's see if we can create a box plot for the height of athletes in Basketball. To do so, we're going to build a list of row indices that correspond to Basketball data.
let mut count = -1;
let mut indices = Vec::<usize>::new();

let mask = games.column(idx_sport).map(|elem| {
    count += 1;
    if(elem == "Basketball") { indices.push(count as usize) };
    elem == "Basketball"
    }
);
Then, we'll use these indices to select from our feature data.
let basketball = features.select(Axis(0), &indices);
We'll take a peek to make sure there were no obvious issues with parsing.
darn::show_frame(&basketball, Some(&feature_headers));
| Age | Height |
|---|---|
| 24.0 | 180.0 |
| 19.0 | 185.0 |
| 29.0 | 195.0 |
| 25.0 | 189.0 |
| 23.0 | 178.0 |
| ... | ... |
| 30.0 | 218.0 |
| 20.0 | 201.0 |
| 28.0 | 201.0 |
| 23.0 | 202.0 |
| 33.0 | 171.0 |
Finally, we'll create a box plot with just the height of the athletes in our dataset.
let mut plot = Plot::new();

let trace = BoxPlot::new(basketball.column(1).to_vec()).name("Basketball");

plot.add_trace(trace);

darn::show_plot(plot);
Looking good.
Athlete Height Grouped by Olympic Games
Now let's do the same as what we've just done for Basketball, but apply it to all the games in our dataset.
let mut plot = Plot::new();
let layout = Layout::new()
    .title(Title::new("Athlete height grouped by Olympic games."))
    .margin(Margin::new().left(30).right(0).bottom(140).top(40))
    .xaxis(Axis::new().show_grid(true).tick_font(Font::new().size(10)))
    .show_legend(false);

plot.set_layout(layout);

for name in unique_games.iter() {
    let mut count = -1;
    let mut indices = Vec::<usize>::new();
    let mask = games.column(idx_sport).map(|elem| {
        count += 1;
        if(elem == name) { indices.push(count as usize) };
        elem == "name"
        }
    );

    let game = features.select(Axis(0), &indices);
    let trace1 = BoxPlot::new(game.column(1).to_vec()).name(name);
    plot.add_trace(trace1);
};

darn::show_plot(plot);
Athlete Age Grouped by Olympic Games
Let's repeat the last visualisation but this time for the age of athletes grouped by Olympic games.
let mut plot = Plot::new();
let layout = Layout::new()
    .title(Title::new("Athlete age grouped by Olympic games."))
    .margin(Margin::new().left(30).right(0).bottom(140).top(40))
    .xaxis(Axis::new().show_grid(true).tick_font(Font::new().size(10)))
    .show_legend(false);

plot.set_layout(layout);

for name in unique_games.iter() {
    let mut count = -1;
    let mut indices = Vec::<usize>::new();
    let mask = games.column(idx_sport).map(|elem| {
        count += 1;
        if(elem == name) { indices.push(count as usize) };
        elem == "name"
        }
    );

    let game = features.select(Axis(0), &indices);
    let trace1 = BoxPlot::new(game.column(0).to_vec()).name(name);
    plot.add_trace(trace1);
};

darn::show_plot(plot);
Conclusion
In this section, we worked towards illustrating the age and height of athletes grouped by games in the 120 years of Olympic history: athletes and results dataset. We avoided hard-coding where possible and presented the data in the form of multiple box plots.


