
Preamble
:dep darn = {version = "0.3.4"}
:dep ndarray = {version = "0.13.1"}
:dep ndarray-csv = {version = "0.4.1"}
:dep ureq = {version = "0.11.4"}
:dep itertools = {version = "0.9.0"}
:dep plotly = {version = "0.4.0"}
extern crate csv;
extern crate itertools;

use std::io::prelude::*;
use std::fs::*;
use ndarray::prelude::*;
use ndarray_csv::Array2Reader;
use std::str::FromStr;
use itertools::Itertools;
use plotly::{Plot, Bar, Layout};
use plotly::common::{Mode, Title};
use plotly::layout::{Axis};
use std::collections::HashMap;
Introduction
In this section, we're going to take a look at some approaches to determining the unique elements in a column of data and their frequency. This is a common task which we may often apply to categorical data, and it can easily give us a good idea of the balance of categorical values across our dataset.
If you're familiar with Python and NumPy, you may have encountered the numpy.unique()function that returns a list of sorted unique elements of an array. In more recent versions of NumPy, the numpy.unique() function also takes a parameter named return_counts, which when set to True will also return the number of times each unique element appears in the array.
Let's see how we can do the same for our ndarray::Array2.
Loading our Dataset
We will continue using the Iris Flower dataset, so we need to load it into our raw string array first.
let file_name = "Iris.csv";

let res = ureq::get("https://datacrayon.com/datasets/Iris.csv").call().into_string()?;

let mut file = File::create(file_name)?;
file.write_all(res.as_bytes());
let mut rdr = csv::Reader::from_path(file_name)?;
remove_file(file_name)?;

let data: Array2<String>= rdr.deserialize_array2_dynamic().unwrap();
let mut headers : Vec<String> = Vec::new();

for element in rdr.headers()?.into_iter() {
        headers.push(String::from(element));
};
Moving Data to Typed Arrays
We need to convert from String to the desired type, and move our data over to the typed arrays.
let mut features: Array2::<f32> =  Array2::<f32>::zeros((data.shape()[0],0));

for &f in [1, 2, 3, 4].iter() {
    features = ndarray::stack![Axis(1), features,
        data.column(f as usize)
            .mapv(|elem| f32::from_str(&elem).unwrap())
            .insert_axis(Axis(1))];
};

let feature_headers = headers[1..5].to_vec();
let labels: Array1::<String> = data.column(5).to_owned();
We will only be using our species labels, stored in labels, throughout the rest of this section.
Unique Elements
We can get the unique elements in our array using the unique() function provided by the itertools crate.
Return an iterator adaptor that filters out elements that have already been produced once during the iteration. Duplicates are detected using hash and equality.
We can then iterate through this and output the elements to the output cell.
for i in labels.iter().unique() {
    println!("{}",i);
};
We can also use the .format() function on .unique() to print out our unique elements.
labels.iter().unique().format("\n")
Iris-setosa
Iris-versicolor
Iris-virginica
"Iris-setosa"
"Iris-versicolor"
"Iris-virginica"
However, we may want to store these in a vector to use later too. Let's store them in unique_elements.
let unique_elements = labels.iter().cloned().unique().collect_vec();

unique_elements
["Iris-setosa", "Iris-versicolor", "Iris-virginica"]
Count of Unique Elements
In this case it's easy to see we have three unique elements, but if the list is too long or we wanted to store the value for later use, we can use the len() function on our vector containing the unique elements.
unique_elements.len()
3
We could also get the count from our iterator.
labels.iter().unique().count()
3
Frequency of Unique Elements
To find the frequency of a specific string we can use filter() and then count().
labels.iter().filter(|&elem| *elem == "Iris-virginica").count()
50
We may also want to find the frequency of every unique element and store it in a vector. We'll call this unique_frequency.
let mut unique_frequency = Vec::<usize>::new();
We can populate this by iterating through the unique elements and use the strings to find the frequency using the filter() approach above.
for unique_elem in unique_elements.iter() {
    unique_frequency.push(labels.iter().filter(|&elem| elem == unique_elem).count());
};

unique_frequency
[50, 50, 50]
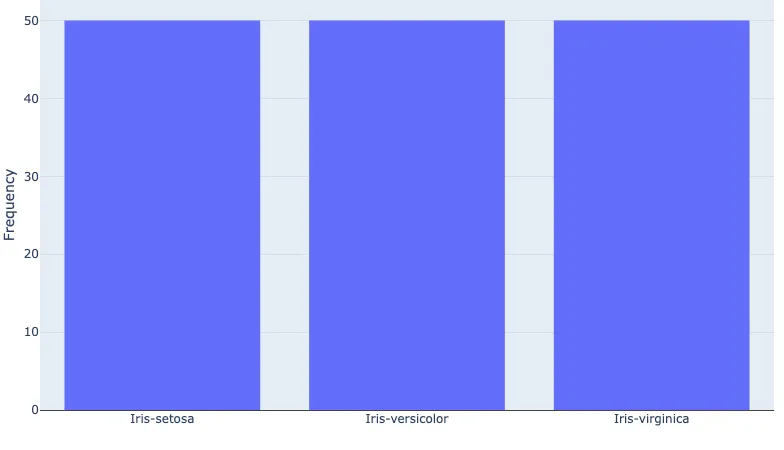
Visualise the Frequency of Unique Elements
It's useful to visualise the frequency of elements in our array, especially if we're interested in looking at the balance in our dataset. We can do this with a Bar plot using Plotly.
let layout = Layout::new()
    .yaxis(Axis::new().title(Title::new("Frequency")));

let freq_bars = Bar::new(unique_elements, unique_frequency);

let mut plot = Plot::new();

plot.set_layout(layout);
plot.add_trace(freq_bars);

darn::show_plot(plot)
Unique Elements and their Frequency with Hashmaps
We can do something similar with a HashMap. First we'll define a variable of type HashMap<String, i32>, where the String part will be the unique element, and the i32 will be the frequency.
let mut value_counts : HashMap<String, i32> = HashMap::new();
We can then populate this by iterating through our original labels array.
for item in labels.iter() {
    *value_counts.entry(String::from(item)).or_insert(0) += 1;
};
Printing out the results, we can see that value_counts now contains all the information that we're after.
println!("{:#?}", value_counts);
{
    "Iris-virginica": 50,
    "Iris-setosa": 50,
    "Iris-versicolor": 50,
}
We can also get these values directly by key.
value_counts.get("Iris-versicolor").unwrap()
50
However, you will need to map this HashMap to separate vectors if you want to use it for plotting with Plotly.
Conclusion
In this section, we've demonstrated a few approaches to identifying the unique elements in an array, counting the number of unique elements, and the frequency of these unique elements. We also visualised the frequency of our unique elements which is useful during exploratory data analysis.